

By: Joseph Goldy, CFP®
Our brain constantly monitors for signs of threats and triggers emotional responses to avoid them. The most primitive part of our brain controls the instinct to prevent hazards.
Forecasting is Not Predicting
This basic survival instinct attaches a high probability to any piece of data forecasting anything. Like the weather forecast, human beings expect predictability regarding the economy and the stock market. However, forecasting should not be considered a prediction.
According to the National Oceanic and Atmospheric Administration, 7-day weather forecasts are accurate about 80% of the time. However, accuracy drops to just 50% for 10-day forecasts – a significant decline for just three more days!
Likewise, using economic indicators to predict recessions or the economy's direction far into the future can be difficult. The Treasury yield curve is one indicator that tends to get a lot of attention when there's talk of recession.
What is the Yield Curve?
The yield curve is simply a picture showing the slope of interest rates over time of a particular bond (usually U.S. Treasuries). Generally, the further you go in time (the longer you hold a bond), the higher the interest rate you expect as an investor.

For example, a 1-month treasury currently yields about 2.70%, and a 10-year yields 3.80%. That seems logical since you would expect a higher return for lending the government money for ten years compared to 1 month.
What is an Inverted Yield Curve?
However, there are times when this yield curve can become inverted – meaning some shorter-term yields are higher than longer-term rates. The chart above shows a current inversion of the 2-year yield compared to the 10-year.
The 2-year bond is at 4.24%, and the 10-year only pays 3.80%. This inverted yield curve is a new development in 2022 due to the Federal Reserve aggressively hiking interest rates. The chart also shows a "normal" upward-sloping yield curve for 2021 and 2020.
Yield curves invert when the Federal Reserve raises short-term interest rates to control inflation like they're doing now. The theory is that by increasing borrowing costs, economic growth begins to slow and, in turn, causes inflation to recede.
Why is an Inverted Yield Curve Newsworthy?
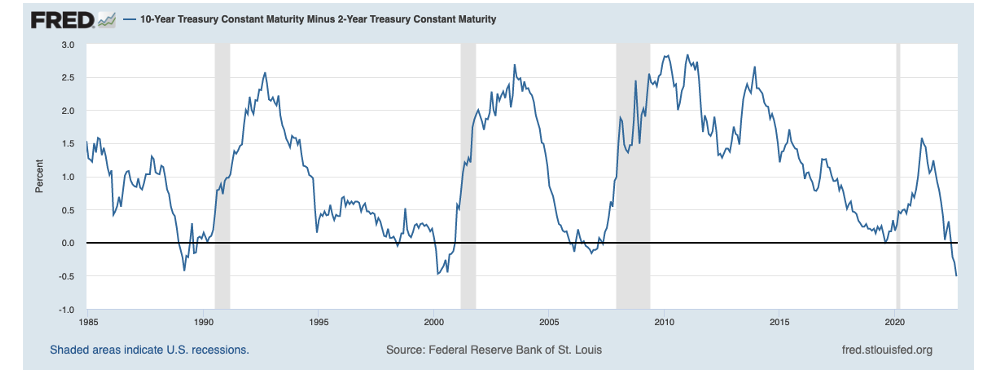
An inverted yield curve has preceded every recession since 1980, as seen in the chart below. The graph simply shows the 10-year bond yield minus the 2-year bond yield. If the line dips below zero, it indicates an inverted yield curve.
Historically, an inverted yield curve coupled with a .50% rise in the unemployment rate has always preceded a recession. The chart below shows our current unemployment rate at 3.70% as of August 2022. The red line shows where the rate would have to rise to be .50% higher. Since a tight labor market is a significant driver of inflation, an increasing unemployment rate is likely as the economy slows in the coming months.

As planners, the two essential questions we ask ourselves are:
Would a recession impact our client's long-term financial plan?
Does a recession warrant a change in our overall investment philosophy or portfolio allocation?
From an investment perspective, perhaps the more important question is not whether a recession will occur but when? And does it even matter?
How Close Does a Recession Follow an Inverted Yield Curve?
A recent analysis by Hartford Funds looked at the time between a yield curve inverting and the start of a recession. Of the five recessions, it looked at going back to 1980, the shortest time between inversion and recession was ten months, and the longest - a whopping 34 months!
If in June of 1998 you went to cash since the yield curve inverted, not only would you have had to wait almost three years (until March 2001) for a recession to begin, but you would also have missed out on cumulative market returns of 21% during that time as measured by the S&P 500.
That brings us to the fundamental question referenced earlier. Does a yield curve inversion warrant a portfolio allocation change? We believe the answer is no.
First, market timing is not only detrimental to your long-term returns but not necessary to be a successful investor in the market. When you look at the data from previous market downturns, you see that some of the most significant "up" days in the market often happen amid whatever crisis the market is facing. Telling yourself, you would be able to guess correctly twice when to sell and when to buy back is delusional.
The second point is just because a recession may be coming, you do not need to time the market or change your overall strategic allocation to be successful. The Hartford study highlighted this fact by showing that the average time from yield curve inversion to a recession was just under 21 months, with the average return of the S&P 500 almost 20%.
Although the market may initially sell off when it recognizes the economy is heading into a recession, it often recovers well ahead of the economy coming out of the downturn since the market is looking ahead for 6-12 months.
At HIGHLAND, we encourage clients to remain committed to their financial plan and avoid the temptation to try and time the market simply because of an inverted yield curve. Many economic indicators work well until they don't. There are no guarantees that just because an inverted yield curve has predicted previous recessions, it always will (or even matters).
Joseph Goldy, CFP®, is a wealth advisor and CERTIFIED FINANCIAL PLANNER™ at Highland Financial Advisors, LLC, a fee-only fiduciary wealth advisory firm based in Wayne, New Jersey.
Joe specializes in working with newly independent women because of divorce or losing a spouse. He understands firsthand the value of having a clear financial picture pre- and post-divorce and a plan to restate goals as a single person. When he is not helping clients, Joe enjoys spending time with his two sons outdoors and volunteering to help raise money for Type 1 diabetes organizations